I. Introduction
There has recently been a record setting boom in Electrical Engineering (EE) and Computer Science (CS) enrollment here at UC Berkeley, and I was intrigued by the prospect of the historical data. Is this enrollment boom a one-off? Is it here to stay? What about the new GPA cap on L&S Computer Science? I was able to get Berkeley’s data from CalAnswers, through the Office of Planning and Analysis, and national data, through the National Science Foundation. What follows is a series of charts with my own commentary.
Software and information technology have become an integral part of the nation’s economy, with profound structural changes occurring in the last 5 decades (the period of this report). The impact of this industry on our lives has been dramatic; 40 years ago computers were used strictly in enterprise, with no wide-scale personal use. The 1980s followed with the rapid development of personal computers, with predictions of computers revolutionizing the home following shortly after. These predictions didn’t immediately materialize; ownership of computers was at 10.2% of American families by 1988. However, it is hard to argue that the software and personal computers developed subsequently by Microsoft and Apple, among others, have not revolutionized life as we know it.
25 years ago, most people didn’t know what the internet was, yet the following 10 years it took the public’s mind, and finances, by storm. That decade gave us Pets.com, but it also gave us Amazon, at first an online bookstore that is now a behemoth giving us a 2-day delivery of just about anything. The boom bust cycle that seems endogenous to the capitalist economy, since its beginnings, appears to be just as present, if not amplified, in the technology sector. In the industry, engineers are hugely important; they are the skilled laborers of today building the technologies of tomorrow. The skill-set coming with the job is not trivial. Often, but not always, the training begins in a University. Looking at the data over the past ~50 years nationwide and ~30 years at Berkeley, one finds that the education of Electrical Engineering and Computer Science students, though broadly trending upwards, is very cyclical in nature up until today; it has booms and busts that swing enrollment back and forth, with much greater volatility than general enrollment. College towns are often cited as beacons of stability in an economy that is subject to fluctuations; This may be true on an aggregate level, but after visiting the data, it doesn’t appear the Computer Science (and possibly other) department(s) are granted this privilege.
The exhibit I have prepared examines four aspects of this cycle through graphs. First, on a national level, the amount of Bachelor’s degrees awarded in Electrical Engineering and Computer Science is plotted alongside the aggregate amount of Bachelor’s degrees awarded. The second analysis looks at how Berkeley is enrolling Electrical Engineering and Computer Science majors relative to the nation (as a percentage of total bachelor’s degrees awarded by year). The third analysis looks at possible links to an external factor: the performance of industry on enrollment. Finally, the cyclical nature of enrollment in Electrical Engineering and Computer Science is not mirrored in overall degrees granted, so the question follows: when Computer Science enrollment is down, what is up? A few of a myriad of possibilities are presented.
II. The General Cyclical Nature

The above graph is an introduction to the analysis and what I believe to be the most striking of the charts I created. On the horizontal axis is the time scale, the left-vertical axis charts the aggregate number of bachelor’s degrees awarded nationwide, and the right-vertical axis charts the number of bachelor’s degrees awarded in Electrical Engineering and Computer Science nationwide (I could do a separate analysis for Electrical Engineering and Computer Science, but each follow a similar trend and for the Berkeley comparisons to follow, the EECS department is one, thus it becomes difficult to separate the two school-wide).
As the chart shows, the overall number of bachelor’s degrees awarded appears to be gradually increasing with a few bumps along the way; it has a fairly linear trend line. The Electrical Engineering and Computer Science numbers are an entirely different story. Enrollment is increasing on an aggregate level, however it fluctuates much more wildly around an imaginary trend line than general enrollment. The cyclical nature of EECS enrollment has presented itself. There was a boom in the mid 80s, followed by a bust in the 90s, which turned back to a boom in the early 21st century, finally cooling off around 2010.
III. EE and CS: Berkeley and the Nation
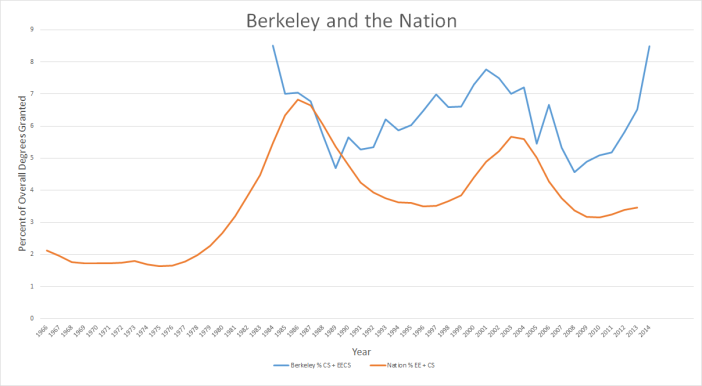
The second graph I created is a comparison of Berkeley against the nation; it shows Berkeley degrees granted in Electrical Engineering Computer Science or Computer Science (through the college of Letters and Science) as a percentage of total degrees, alongside the national percentage of degrees granted in Electrical Engineering and Computer Science. A couple notable observations follow. First, though the Berkeley line is more jagged (small swings in enrollment are more prominent as there isn’t a whole nation to smooth enrollment variations school by school), it follows the general trend line of the nation’s enrollment. Second, the enrollment of Berkeley students seems to be about consistently two percentage points higher comparing peak to peak and trough to trough. Additionally, the Berkeley line appears to be leading the national line by a factor of about two to three years. An explanation, for both the leading nature of Berkeley’s cycle, and the overall higher enrollment, could be the fact that the heart of the technology industry is in Silicon Valley right down the road.
IV. The Stock Market: An Inquiry into the NASDAQ

The third graph was the original graph of my analysis in light of a Quora post that was somewhat of an inspiration. The question behind my search was: do economic fluctuations themselves have an influence on the enrollment in Computer Science (and Electrical Engineering)? That is a tough question to answer, however the calculated correlation coefficient of my graph is r = 0.66; this is not insignificant, though not astounding.
The above post mentions that the size of Computer Science graduating classes lags behind tech stocks by a couple years—perhaps because people choose their major a couple years prior to graduation and thus graduate slightly behind the industry cycle. Since Berkeley’s EECS enrollment leads the rest of the nation by a few years, it seems to match up with industry fluctuations quite well (though the glut in enrollment around the dot-com era boom does outlast the crash by a few years).
It is also notable that the first enrollment boom in Electrical Engineering and Computer Science, in the 1980s, also mirrored the excitement in personal computers. Though this bump can’t really be found in the NASDAQ data, it was certainly a phenomenon with a boom, and a temporary reset, as explained here and here.
V. Countercyclical Studies

The fourth graph I created resulted from digging through the data. The original version of this graph had far more majors, but become impossible to view (aside: Mechanical Engineering and Math/Statistics have incredibly stable enrollment). I picked out a handful of majors that seemed to answer the question I was asking; if enrollment is generally linear, but Electrical Engineering and Computer Science enrollment is cyclical, where is the slack picked up during the busts and where does it come from during the booms? In other words, what are the countercyclical majors relative to Electrical Engineering and Computer Science? I was able to find many interesting observations, but have left an abridged version of what appears to be the most prominent countercyclical groups I could find.
The graph denotes the percentage of total degrees granted in a particular field nationally, by year. The first countercyclical study is Psychology. At the beginning of my chart, Psychology is going through a boom in enrollment while Electrical Engineering Computer Science enrollment is pretty stagnant (I have no data prior 1966; was their an EECS boom prior to the 80s?). Then, as the percent of Psychology degrees declines, Electrical Engineering Computer Science picks up. The roles reverse a couple times before psychology seems to taper off at around 6% (What caused the decrease in volatility? Another topic worth investigating). Biological Sciences is the second major I put on the chart, it also seems to be going through volatile cyclical swings similar to EECS, only in the opposite direction. History is the last major I chose, partially because this is a history class and partially because it dropped off sharply when EECS picked up. Since then, History has been countercyclical, but the amplitude of the swings has been moderate.
VI. Conclusion
Overall, the enrollment in Electrical Engineering and Computer Science has been volatile since the 1960s, much more so than general enrollment: EECS enrollment has gone through two boom and bust cycles. Berkeley has not been spared these fluctuations; it has instead seen higher relative enrollment than the nation in Electrical Engineering and Computer Science, while the cyclical fluctuations occur slightly earlier here in Berkeley. The fluctuations seem to mirror periods of excitement and disappointment in industry: the PC boom of the mid 80s and the dot-com fiasco of the late 90s map quite well to the enrollment booms. Finally, the cyclical nature of enrollment is not confined to EECS alone: a selection of Psychology, Biological Sciences, and History (among many others) have all undergone similar volatile swings in enrollment, in what I observe as a countercyclical manner.
